

Backtest Trading Strategies Like a Regulator for Traders
Use a regulator-style, evidence-based workflow to backtest trading strategies: precise rules, realistic fills, out-of-sample validation, and paper trading...

Backtesting means applying a fully specified set of trading rules to historical price data to see how the strategy would have performed. The SEC treats this as a quantitative modeling exercise, and its guidance is blunt about the one thing that separates a useful backtest from a dangerous one: realistic execution assumptions plus honest validation. Skip either, and metrics like expectancy or profit factor become fiction. Backtestify builds its reporting around exactly that standard, moving results through in-sample testing, out-of-sample checks, and paper trading before a single dollar is at risk.
TL;DR:
- Backtesting must include realistic execution assumptions and honest validation to produce reliable results, with data spanning multiple market regimes and free of look-ahead bias.
- Data quality issues such as corporate actions adjustments, correct timestamp alignment, inclusion of delisted securities, and modeling of costs and slippage are common sources of faulty backtest outcomes.
- Using a small number of trades or a single market cycle limits reliability, as larger, varied samples provide more meaningful insights into strategy durability.
- Relying solely on win rate is misleading; focus instead on expectancy, profit factor, maximum drawdown, and worst streaks to assess true strategy robustness.
- Tools like Backtestify implement structured workflows that disclose assumptions, generate complete trade lists, and compare original versus optimized rules to boost backtesting transparency.
Table of Contents
- How Do You Backtest a Trading Strategy Step by Step?
- What Data and Execution Details Actually Matter?
- What Are the Most Common Backtesting Mistakes?
- Which Metrics Actually Tell You If a Strategy Works?
- Manual Replay or Code Framework: Which Should You Use?
- How Backtestify Applies This Workflow in Practice
- What Backtests Can and Cannot Tell You
- Try a Real Backtest Before You Risk Real Capital
- Sources
- FAQ
How Do You Backtest a Trading Strategy Step by Step?
A backtest is only as good as the rules feeding it. Vague ideas like "buy on strength" produce vague, unreproducible results. Here's the sequence that holds up under scrutiny.
- Write unambiguous rules. Specify entry triggers, exit triggers, stop placement, position sizing, and the exact timeframe. A moving-average crossover strategy, for instance, needs the precise periods (say, a 10-period and 50-period simple moving average), whether you enter at the next bar's open, and what percentage of capital each trade risks.
- Choose historical data spanning multiple regimes. Testing only a bull market year tells you nothing about how a strategy handles a drawdown-heavy period. Pull adjusted data that accounts for splits and dividends, and stretch the window across at least one full market cycle where possible.
- Specify cost and fill models before you run anything. Decide on commissions, spread assumptions, and slippage per trade type. This step happens before you see results, not after.
- Run in-sample tests and keep all parameter tuning contained there. This is where you refine entry filters or stop distances. Once you leave this phase, the rules are locked.
- Validate on untouched out-of-sample or walk-forward windows. Data the strategy has never touched is the only honest test of whether the edge survives outside the tuning set.
- Paper trade before committing capital. This step catches execution and data-feed issues that no historical simulation can fully replicate.
Regulatory guidance on statistical testing, including the SEC's order on the ICC Back-Testing Framework, stresses that larger and more varied samples produce more reliable inferences. A 40-trade sample from a single quarter is not evidence. A few hundred trades across multiple regimes starts to mean something.
What Data and Execution Details Actually Matter?
Most backtest failures trace back to data quality or unrealistic fills, not bad strategy logic. Before trusting any output, confirm these elements are handled correctly.
- Corporate actions (splits, dividends, mergers) are adjusted into the price series, not left raw.
- Timestamps align correctly between your signal generation and your data source's bar close.
- The dataset includes delisted or failed securities, not just survivors currently trading.
- Commission schedules, bid/ask spread, and slippage are modeled per trade, not assumed away.
- Partial fills and liquidity thresholds are accounted for on thinly traded instruments.
- Borrow costs and financing fees are included for any short or leveraged position.
Timing granularity trips up more traders than any other single issue. If your signal fires on a candle's close, you generally cannot fill at that same close unless you're modeling an executable closing auction. Otherwise, the fill belongs on the next bar, or you need intrabar data to simulate it honestly. The SEC's enforcement history includes cases where this exact kind of timing error inflated reported performance.
Pro Tip: Publish your assumptions next to your results, even informally. A short table listing commission rate, slippage estimate, and data source next to your equity curve forces you to defend every number, and it's the fastest way to catch a fill assumption you forgot to model.
What Are the Most Common Backtesting Mistakes?
Look-ahead bias tops the list. It happens when a backtest uses information that would not have been available at the time of the trade, often through a subtle timing error in how signals and fills are sequenced. The SEC's case against F-Squared Investments is the clearest cautionary tale on record: a calculation error that let the model see future data inflated the firm's reported performance by roughly 350%, and the firm advertised those hypothetical numbers as real results. Catch it by shifting your signal one bar forward and confirming performance doesn't collapse.
Other red flags worth checking every time:
- Survivorship bias. Confirm your data vendor includes delisted and bankrupt securities, not just the winners still trading today.
- Overfitting. An equity curve that's too smooth, or a strategy that falls apart when you nudge one parameter by 10%, is a warning sign, not a strength.
- Cherry-picked reporting. Publishing only the best parameter set from a grid search, or the best date range, misrepresents the strategy's real edge.
- Missing full trade lists. Any report showing only summary statistics without the underlying trades invites hidden errors.
Which Metrics Actually Tell You If a Strategy Works?
Win rate gets too much attention. A strategy that wins 70% of the time can still lose money if the average loss dwarfs the average win. The SEC's guidance is explicit that win rate alone is a poor decision metric. Look at these together instead:
- Expectancy: the average dollar (or R-multiple) gained or lost per trade across the full sample.
- Profit factor: gross profit divided by gross loss, where anything above 1.5 generally signals a durable edge.
- Max drawdown: the largest peak-to-trough decline, which tells you how much capital you'd need to survive the worst stretch.
- Worst losing streak: consecutive losses matter for psychology and position sizing, even when expectancy is positive.
- Average R and exposure: how much risk each trade carries and how much time capital sits committed.
A strategy showing $1.20 in expectancy per trade with a 35% max drawdown demands a smaller position size than one with $0.80 expectancy and a 12% drawdown, even though the first looks better on paper. Run sensitivity checks on every metric. Nudge your stop distance by 20% and see if profit factor holds. If it collapses, you've likely found an overfit parameter rather than a real edge.
Manual Replay or Code Framework: Which Should You Use?
Discretionary traders testing chart-pattern setups benefit from manual bar-by-bar replay, since it forces you to make decisions without seeing future price action, which is the best defense against hindsight bias. Rule-based, mechanical strategies scale better with code, since automated frameworks can run thousands of trades across years of data in minutes.
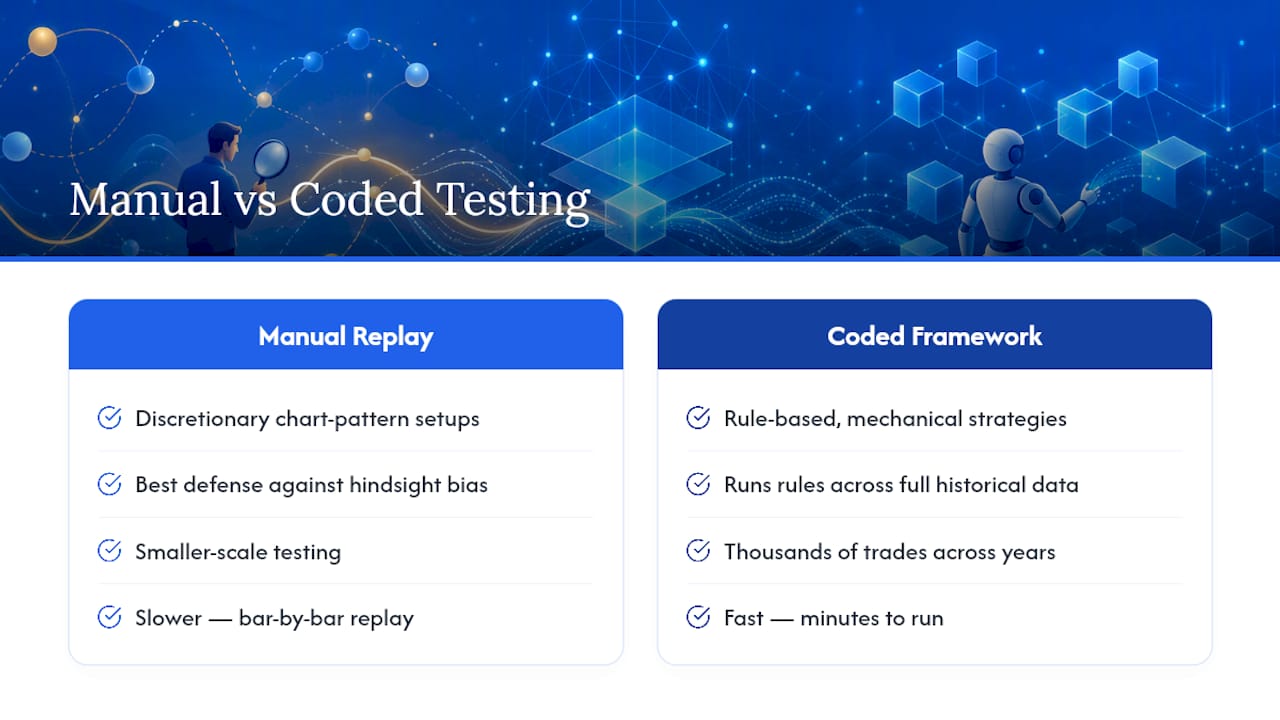
Free frameworks exist for both. Backtesting.py is a Python library with worked examples, including moving-average crossovers and configurable commission assumptions, that's a reasonable starting point for coded strategies. Manual replay tools built into most charting platforms work well for discretionary practice. Whichever you choose, verify the same things: data provenance and timestamp fidelity, corporate-action handling, realistic cost modeling, and whether the tool exports a full trade list for review. A tool that only shows you a summary chart isn't giving you enough to audit the result.
How Backtestify Applies This Workflow in Practice
Backtestify was built around the same sequence this article describes: precise rule entry in plain English, historical simulation against real market data, and side-by-side comparison of original versus improved rule sets. Every published report follows a consistent structure so results are checkable, not just claimed.
A transparent Backtestify report includes:
- The full assumption set (fees, slippage, data window, timeframe) disclosed alongside results.
- A complete trade list, not just summary statistics.
- Core metrics including win rate, profit factor, and max drawdown.
- A direct comparison between the original strategy rules and any improved version tested on the same data.
The platform's published strategy library applies this same format to strategies drawn from popular trading content creators, publishing both winning and losing results rather than curating only the favorable ones.
What Backtests Can and Cannot Tell You
A backtest narrows a universe of ideas down to a handful worth risking real capital on. It cannot replace small live sizing and a staged ramp-up. Before going live, confirm reproducibility, disclosed assumptions, a completed paper-trade phase, and position sizing that survives your worst historical drawdown. Start small, scale slowly.
— WAJDI
Try a Real Backtest Before You Risk Real Capital
Backtestify's edge over building spreadsheets or piecing together free scripts is simple: you get a reproducible report with full assumptions, a complete trade list, and side-by-side comparisons of original versus improved rules, without writing a line of code.
Start with the step-by-step backtesting guide to see the workflow applied to a real strategy, or browse the published strategy library to check how a moving-average pullback or trendline setup actually performed on historical data. The Free tier lets you run a simple moving-average test yourself before deciding whether the Pro plan, listed at $29 per month or $190 per year on Backtestify, fits your workflow. If you want to see exactly how the simulation engine handles fills and costs, the methodology page breaks it down line by line.
This article is general information, not a substitute for advice from a qualified financial advisor. Consult a qualified financial professional about your own circumstances before acting on anything here.
Sources
FAQ
How Can I Backtest a Trading Strategy?
Write precise entry, exit, and position-sizing rules, then apply them to clean historical data using either a coded framework or a platform like Backtestify. Run the test in-sample first, validate on out-of-sample data the strategy hasn't seen, then paper trade before committing real capital.
Can ChatGPT Backtest a Trading Strategy?
ChatGPT and similar tools can translate plain-English strategy ideas into precise, testable rules and can review or generate backtesting code. It cannot supply verified historical market data or guarantee correct order fills, so any code or data it produces still needs independent verification before you trust the results.
What Are Common Backtesting Mistakes?
The biggest ones are look-ahead bias, survivorship bias, and overfitting to a single historical period. The SEC's case against F-Squared Investments shows how a look-ahead timing error inflated reported performance by roughly 350%, which is why full trade lists and disclosed assumptions matter more than a clean-looking summary chart.
Where Can I Backtest My Strategy for Free?
Free options include coded frameworks like Backtesting.py for Python users and manual chart-replay tools built into most charting platforms. Backtestify also offers a Free tier for running basic strategy tests before upgrading to unlimited access.