

How to Backtest YouTube Strategies Before You Trade Them
Turn a YouTube trading setup into testable rules, run it on real historical data, and read the results honestly before you risk a dollar of your own capital.

To backtest a YouTube strategy, you rewrite the creator's setup as fixed entry, exit, sizing and risk rules, run those rules on historical prices, and judge the trade-by-trade results with a few core metrics. The video shows you a handful of trades the creator chose to show. A backtest shows what the same rules did across hundreds of trades, including the ugly ones.
This guide walks through the whole process: what a backtest can and cannot prove, how to extract rules from a video, what data to use, which numbers to read, and how to catch results that look better than they are.
TL;DR
- A video is a story. A backtest is a sample. Convert the setup into written, unambiguous rules first, then test those rules on history you did not use to design them.
- Include costs: commissions, spread and slippage. A strategy that looks great without them can turn flat or negative with them.
- Read win rate together with profit factor, expectancy and maximum drawdown. No single number tells you whether a setup is worth trading.
- Treat unusually perfect results (very high win rate, no losing months) as a sign of a flaw in the test, not as a discovery.
- Finish with paper trading or minimal size. A backtest tells you what the rules did in the past, not what the next price movement will be.
Table of Contents
- What it means to backtest a YouTube strategy
- Turn the video into written rules
- Choose data, markets and assumptions
- Run the backtest step by step
- Read the numbers that matter
- Spot results that are too good
- Improve the strategy without fooling yourself
- What a backtest says about the next price move
- Test a YouTube strategy with Backtestify
- FAQ
- Sources
What it means to backtest a YouTube strategy
Backtesting means taking a strategy, running it against historical data, and seeing how it would have performed. When the strategy comes from a video, the exercise has one extra step: you first have to find out whether there is a strategy at all.
Many videos mix a real rule set with commentary, intuition and hindsight. "I like this area" or "the candle looks strong" cannot be tested, because two people watching the same chart will disagree. Your first job is to separate what can be written as a rule from what is judgment.
What a backtest can establish
A good backtest can tell you:
- Whether the rules, applied mechanically, had a positive expectancy over a meaningful sample.
- How large the losing streaks and drawdowns were, so you can judge whether you could stick with the strategy.
- How sensitive the result is to costs and to small changes in settings.
- Whether the strategy worked in more than one market phase, such as trending, choppy, calm and volatile periods.
What it cannot establish
A backtest cannot promise future returns. Markets change, liquidity shifts and live execution is messier than a simulation. It also cannot rescue a vague strategy: if you fill in the blanks yourself while looking at the chart, you are testing your own hindsight, not the creator's idea. That is why the next step matters most.
Turn the video into written rules
Before opening any chart, write the strategy down as a short specification. The aim is that someone who has never seen the video could apply it and get the same trades you do. Write down:
- Market and timeframe. Which instrument, which chart interval, which session if it matters.
- Entry trigger. The exact condition. "Price closes above the 50-period moving average after touching the lower band" is testable. "Price looks ready to move" is not.
- Invalidation and stop. Where the trade is wrong, expressed as a price rule or a distance, such as a multiple of average true range.
- Exit. A target, a trailing rule, a time exit, or a combination.
- Position sizing. A fixed percent of account risked per trade is the simplest to test and compare.
- Filters. Time of day, trend direction, volume, news days to skip.
Two habits keep this honest. First, write the rules before you look at price history, because rules defined while staring at the data end up fitted to it. Second, once the test starts, do not change the rules midstream. If you change them, you have started a new test and the earlier result no longer counts.
Handling the fuzzy parts
Some creators rely on discretion: "I only take the clean ones." You have three honest options. Define "clean" with a measurable rule, such as a minimum distance from the last swing or a volume threshold. Test the version with no filter and see what the raw setup does. Or drop the idea. What you should not do is quietly keep the trades that look good in hindsight.
If you want to skip the manual translation, Backtestify lets you enter a strategy in plain English and runs it on real historical data. It also publishes results for strategies from popular creators, including a Tori Trades trendline strategy report, and the wider published strategy library includes both winners and losers, so you can see how a known setup actually performed before you build your own test.
Choose data, markets and assumptions
The data you pick decides whether the result means anything. A few principles apply to nearly every strategy.
Test the market and timeframe the creator uses, then widen it
Start with the instrument and timeframe from the video, because that is the claim you are checking. Then run the same rules on related markets and nearby timeframes. A setup that works on one chart over one stretch and nowhere else is more likely luck than edge.
Use enough history and enough trades
How much history you need depends on how often the strategy trades. One practical guide to validation suggests at least two years of daily data, roughly 500 bars, as a floor, and also suggests keeping part of the data aside for an out-of-sample check (CLI Trader). Intraday strategies need more bars but less calendar time, while slower strategies need longer spans to include different market regimes.
Sample size matters as much as the date range. Thirty trades can be flattered by a single good month. A common rule of thumb is to aim for at least a hundred trades before you trust the averages, and more is better. For fast strategies, our guide to intraday backtesting covers the data and execution issues in more depth, and the scalping strategy backtest guide does the same for very short holding periods.

Model costs and execution
Set commissions, spread and slippage before the first run, not after. Slippage is the gap between the price you expected and the price you got, and it grows around breakouts and news. A strategy with a thin edge per trade can lose all of it to costs. If a setup only works with zero costs, it does not work.
Avoid biased data
Two data problems catch beginners often:
- Survivorship bias: testing only on assets that exist today and ignoring those that collapsed or were delisted. For long-biased stock strategies this can make results look much better than they were (quant.xme.cz).
- Look-ahead bias: using information the strategy could not have known at the time, for example deciding on a candle's close and then filling at its open. The same page explains that an event-based testing framework prevents the logic from accessing future data.
Backtestify describes how it simulates trades, fills and data handling on its methodology page, which is worth reading so you know the assumptions behind any report you see.
Run the backtest step by step
Whether you use a charting platform's replay, a spreadsheet or a dedicated tool, the workflow is the same.
- Write the rules. Use the specification above.
- Pick instruments and a date range. Include at least one trending and one sideways period.
- Run the test. Mechanical rules can be automated. Discretionary rules need manual replay, which is slower and prone to peeking ahead.
- Record every trade. Entry, exit, size, result in dollars and in R (multiples of your initial risk).
- Calculate the metrics. The next section covers which ones.
- Stress it. Add higher costs, shift the parameters slightly, test on other markets.
- Check out of sample. Test on data you set aside and did not touch while designing.
- Forward test. Paper trade or trade tiny size before real risk.
Our step-by-step backtesting guide goes through each stage in more detail, and the strategy validation checklist gives ten checks to run before you commit capital.
Read the numbers that matter
A video will usually quote one flattering stat. A backtest gives you a full set, and you should read them together.
| Metric | What it tells you | How it is calculated |
|---|---|---|
| Win rate | How often trades win | Winning trades / total trades |
| Profit factor | Size of gains vs. losses | Gross profit / gross loss |
| Expectancy | Average result per trade in R | (Win rate x average win) - (loss rate x average loss) |
| Maximum drawdown | Worst peak-to-trough decline | (Peak equity - trough equity) / peak equity |
These formulas follow the definitions in a performance metrics lesson, which also gives a useful example: a strategy that wins 45% of the time with an average win of 2R and an average loss of 1R has an expectancy of +0.35R per trade.
Why win rate alone misleads
A 70% win rate sounds impressive until the average loss is three times the average win. Many popular videos highlight win rate because it feels good. Expectancy and profit factor show whether the wins pay for the losses. A profit factor above 1.0 means gross profit exceeds gross loss, but a thin 1.05 can vanish after slightly higher costs.
Drawdown is about you, not just the strategy
Maximum drawdown tells you how much pain the rules produced historically. If the test shows a 35% decline and you know you would abandon any strategy after a 15% loss, the strategy is wrong for you, however good the average looks. Size positions so that the historical worst case is survivable, and assume the future worst case may be worse.
Spot results that are too good
The most common outcome of backtesting a YouTube setup is not "it fails." It is "it looks wonderful" for the wrong reasons. Watch for these signs:
- A very high win rate with tight stops. This often points to look-ahead bias or unrealistic fills.
- A profit factor far above what real strategies tend to produce. Some practitioners treat readings above 3.0 as suspicious, and the metrics lesson above makes the same point.
- No losing months at all. Real strategies lose. A smooth curve usually means the test is leaking future information or has been fitted to the sample.
- Results that collapse when one setting moves. If changing a moving-average length from 50 to 45 turns a winner into a loser, you found a lucky parameter, not a robust edge.
- Very few trades. Great statistics on a small sample are noise.
The underlying problem is overfitting: tuning rules until they fit past data perfectly, which makes them worse at handling new data. Our guide to spotting and stopping overfitting explains the warning signs, and the piece on strategy optimization without overfitting shows how to improve rules while keeping the test honest. A practical safeguard is to split your data: design on one part, then test once on the part you held back, and accept that the held-back result will usually be somewhat weaker.
Another common trap: cherry-picked history
Creators naturally show examples that illustrate their point. If a setup looks great on the three charts in the video, the question is what it did on the other three hundred. Testing across a long, continuous history, not a handpicked window, is the cleanest answer.
Improve the strategy without fooling yourself
Once you have a baseline result, you may want to improve it: add a trend filter, move the stop, change the exit. This is legitimate, with one rule: compare the original and the improved version on the same data, and judge the improvement on data it was not tuned on. If an added rule lifts results only on the period you tuned it for, it probably fits noise.
Keep the original result visible. A side-by-side comparison of the original and improved rules on recent data is the clearest way to see whether a change adds real value or just reshuffles the same trades. That is how Backtestify's improvement reports are laid out, and the idea works in a spreadsheet as well.
What a backtest says about the next price move
Historical results describe how rules behaved, not what the market will do next. What a backtest can give you is a probability-weighted view: given conditions like these, how often did the outcome go one way, and by how much? That is useful for deciding whether a setup has an edge, but it is not a guarantee for the next trade.
If you want a forward-looking estimate, Backtestify's forecast feature reports probability and confidence statistics rather than a single confident call. Use it as one input, size positions for the case where it is wrong, and confirm the idea in live conditions.
Forward test before real size
After the historical work, paper trade or trade at minimal size. Live trading exposes execution problems a backtest hides: partial fills, platform delays, and your own hesitation. Our comparison of backtesting and paper trading explains when to use each. A sensible approach is to go live with small risk per trade, for example well under 1% of the account, and scale only when live results track the test.
The broader habit is what we call evidence-based trading: decide from tested data, not from how convincing a presenter sounds. For a fuller process, see our article on backtesting trading strategies rigorously.

Test a YouTube strategy with Backtestify
Backtestify is built for this exact job. You describe the strategy in plain English, it runs on real historical market data, and you get trade-by-trade results with win rate, profit factor and maximum drawdown. You can then improve the rules, compare the original and improved versions, and export the result in TradingView Pine Script format.
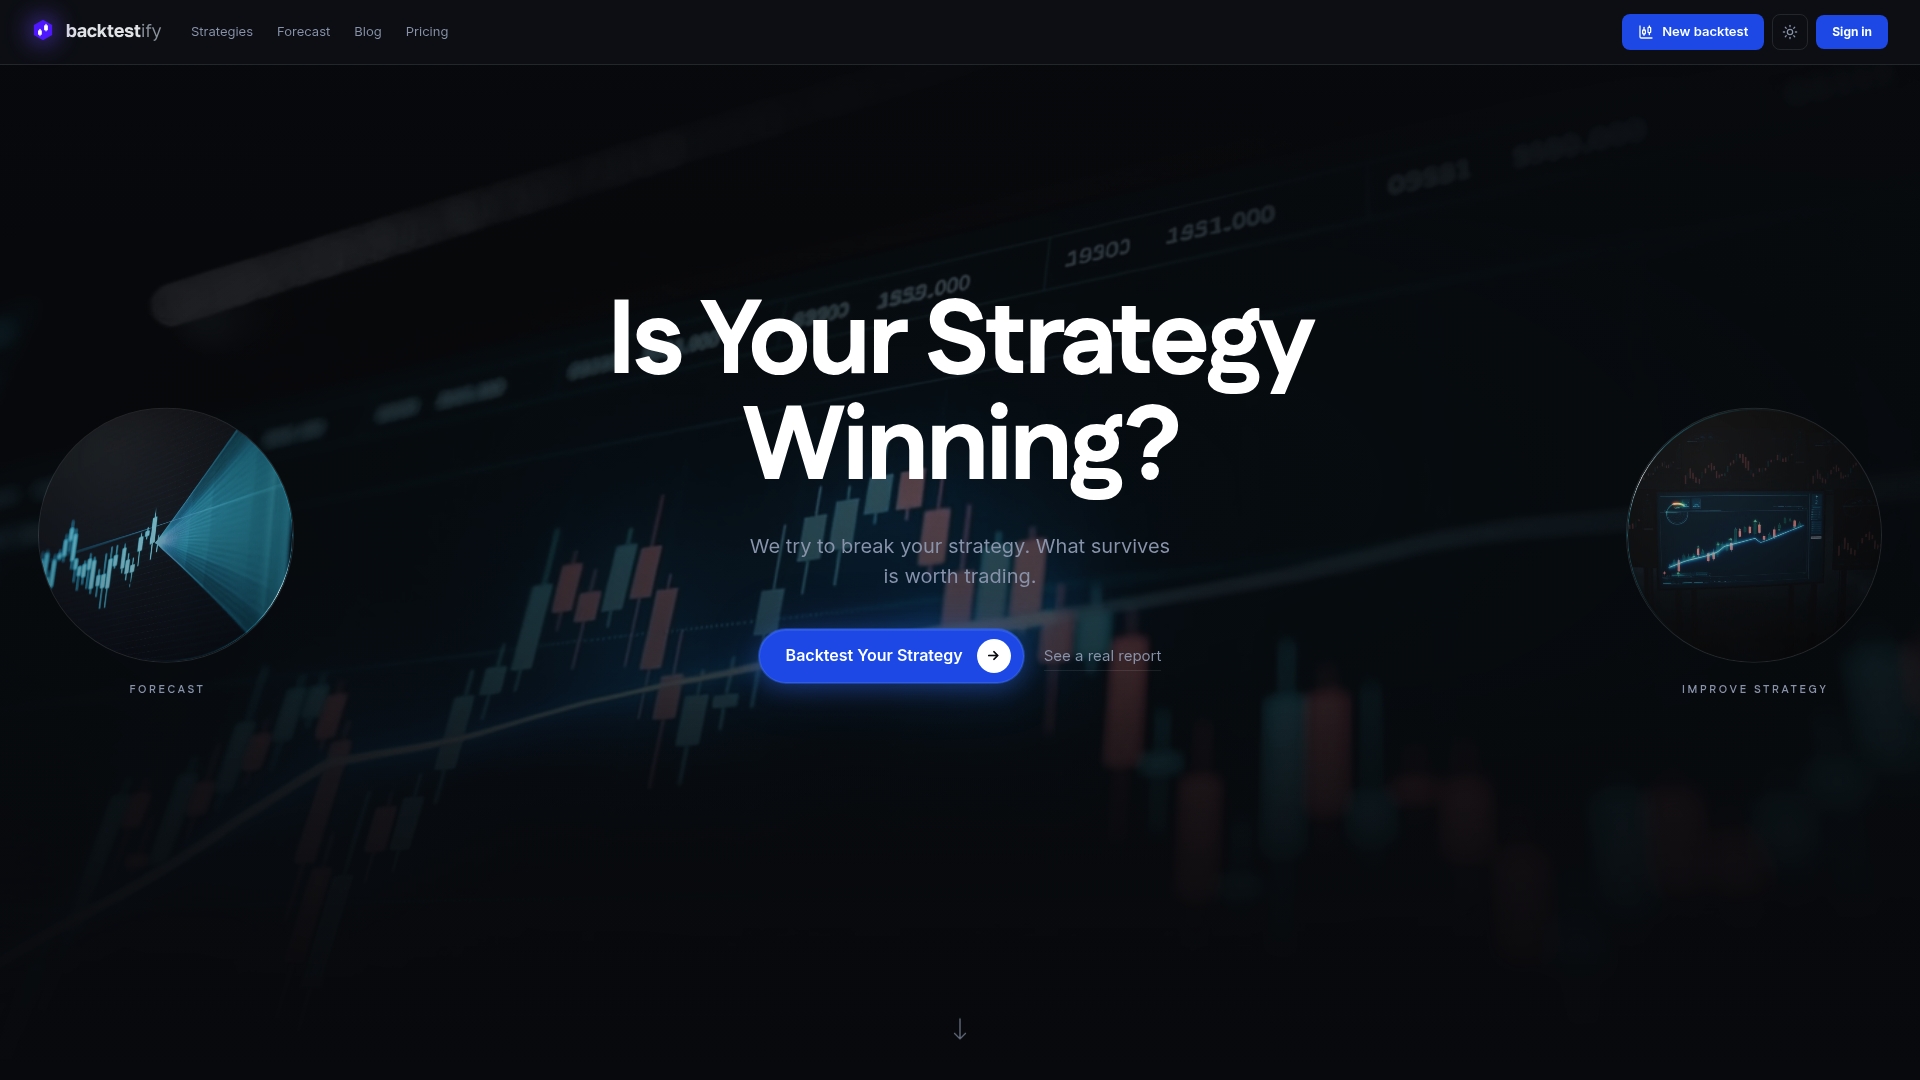
The Free plan lets you get started, and Pro adds unlimited backtesting, improvement and forecasting for $29 per month or $190 per year. You can start with Backtestify and test the next setup you see before it costs you anything.
FAQ
How many trades do I need before I trust a backtest?
Aim for at least 100 trades, and more if the strategy has several parameters. Fewer trades leave the result at the mercy of a few lucky or unlucky streaks. Also check that the trades are spread across different market conditions, not clustered in one rally.
Can I backtest a strategy if the creator never states exact rules?
Yes, but you are then testing your interpretation, not theirs. Write the most literal version of what they show, test it, and label it as your version. If the rules cannot be made objective, the setup cannot be backtested honestly.
Why do my results differ from the numbers in the video?
Common causes are costs and slippage, a different date range, hand-picked examples in the video, or look-ahead bias in the original test. Rerun your test with realistic costs and a longer history before drawing conclusions.
Is a good backtest enough to start trading real money?
No. It shows the rules had an edge in the past. Check the result out of sample, paper trade or use minimal size, and risk only what you can afford to lose while live results build up.
Sources
- Common backtesting problems and how to avoid them
- Backtesting & Validation, CLI Trader
- Performance Metrics lesson, FX Foundations