

Maximum Drawdown for Traders: Spot 50% Losses That Need 100% Gains
Calculate maximum drawdown, run backtest checks to expose hidden risk, and validate trading strategies with peak to trough examples.

Maximum drawdown (MDD) is the largest peak-to-trough percentage loss an investment or strategy has experienced over a specified period. It shows the worst historical stretch of pain an investor or trader would have had to sit through, in real dollars and real months. Use it alongside a defined time window and other risk metrics, never alone, and it becomes one of the sharpest tools you have for testing whether a strategy actually fits your risk capacity.
TL;DR:
- Maximum drawdown measures the largest percentage loss from a portfolio's peak to trough, and its relevance depends on the asset class and time window.
- Proper calculation requires tracking the equity curve, identifying peaks and troughs, and applying the formula to assess worst-case historical declines.
- Risk management should consider drawdown duration and recovery time, which can be asymmetrical and threaten long-term viability.
- MDD is backward-looking and sensitive to start and end dates, so it must be used with other risk metrics and in context for realistic assessment.
- Backtest analysis, including tests for bias and stress-testing, ensures the reported MDD reflects potential real-world worst-case scenarios.
Table of Contents
- What Is Maximum Drawdown? A Formal Definition
- How to Calculate Maximum Drawdown: Formula and Example
- Drawdown Duration and Recovery Time
- Interpreting MDD for Portfolio and Investor Risk Profiles
- Using Maximum Drawdown When Backtesting a Strategy
- Balancing Drawdown Risk With Return Objectives
- Test Your Own Drawdown Numbers Before You Trade Them
- Sources
- FAQ
What Is Maximum Drawdown? A Formal Definition
A drawdown is any decline from a portfolio's most recent peak to a subsequent low point before a new peak forms. Maximum drawdown is the largest of those declines across the entire history you're examining. Academic treatments formalize this as D(T) = max over the interval of [peak value minus current value], with MDD(T) representing the maximum of all drawdowns observed up to time T, as laid out in technical drawdown research.
That's distinct from average drawdown, which smooths across every dip a portfolio has taken, not just the worst one. MDD cares about the single ugliest stretch.
Maximum drawdown is the largest observed decline in value from a peak to a trough. It's useful for benchmarking downside risk, but it's backward-looking and offers no guarantee that future drawdowns won't be larger, according to Investopedia's breakdown of the metric.
Extensions like conditional drawdown-at-risk exist for readers who want to model drawdown risk probabilistically rather than just capture the worst historical case, as described in optimization-focused drawdown research.
How to Calculate Maximum Drawdown: Formula and Example
The formula is simple: MDD = (Trough Value − Peak Value) / Peak Value, expressed as a percentage. The hard part is finding the right peak and trough pair, and doing that correctly requires walking through the equity curve in order.
Here's the process, step by step:
- Build the equity curve. List portfolio or account value at each period (daily, weekly, per trade).
- Track the running peak. At every point, record the highest value seen so far.
- Compute the drawdown series. At each point, calculate (current value − running peak) / running peak.
- Find the minimum. The most negative number in that series is your maximum drawdown.
- Note the dates. Record when the peak occurred and when the trough occurred. You'll need both for duration analysis.
Pro Tip: Don't stop at the single worst drawdown. Run the same four steps on rolling 12-month windows across your history. A strategy that shows a tame overall MDD can be hiding a brutal 6-month stretch buried in the middle of an otherwise smooth curve.
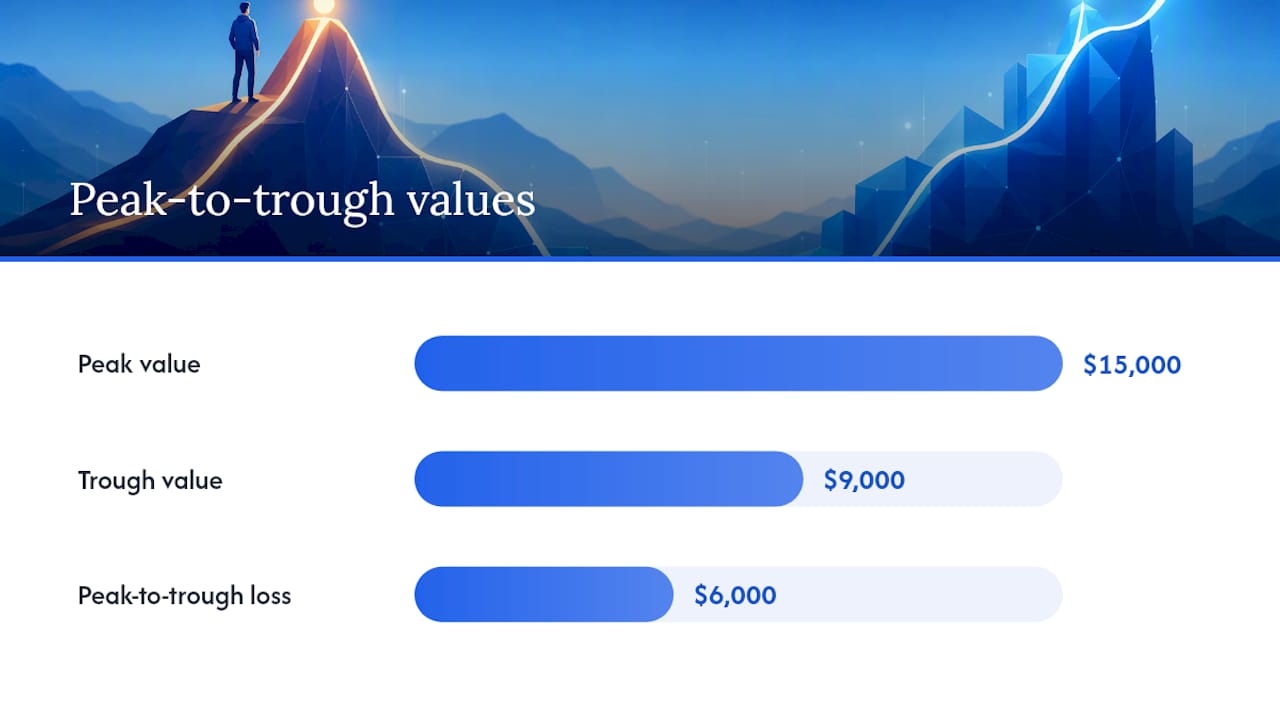
A worked example. Say a trading account grows from $10,000 to a peak of $15,000, then falls to $9,000 before recovering and climbing to a new high. That $6,000 loss, relative to the $15,000 peak, is the number that matters, not the loss relative to the original $10,000 starting balance. This peak-to-trough framing, confirmed in Wall Street Prep's MDD methodology, is where most amateur calculations go wrong.
In Excel, this is a rolling-max formula (=MAX($B$2:B2)) next to a drawdown column (=(B2-C2)/C2), then =MIN() on the drawdown column. In pseudocode: peak = max(values[0:i]) at each index i, then drawdown[i] = (values[i] - peak) / peak, then MDD = min(drawdown).
Drawdown Duration and Recovery Time
The percentage figure only tells half the story. Drawdown duration covers the time from peak to trough, and recovery time covers the time from that trough back to a new peak.
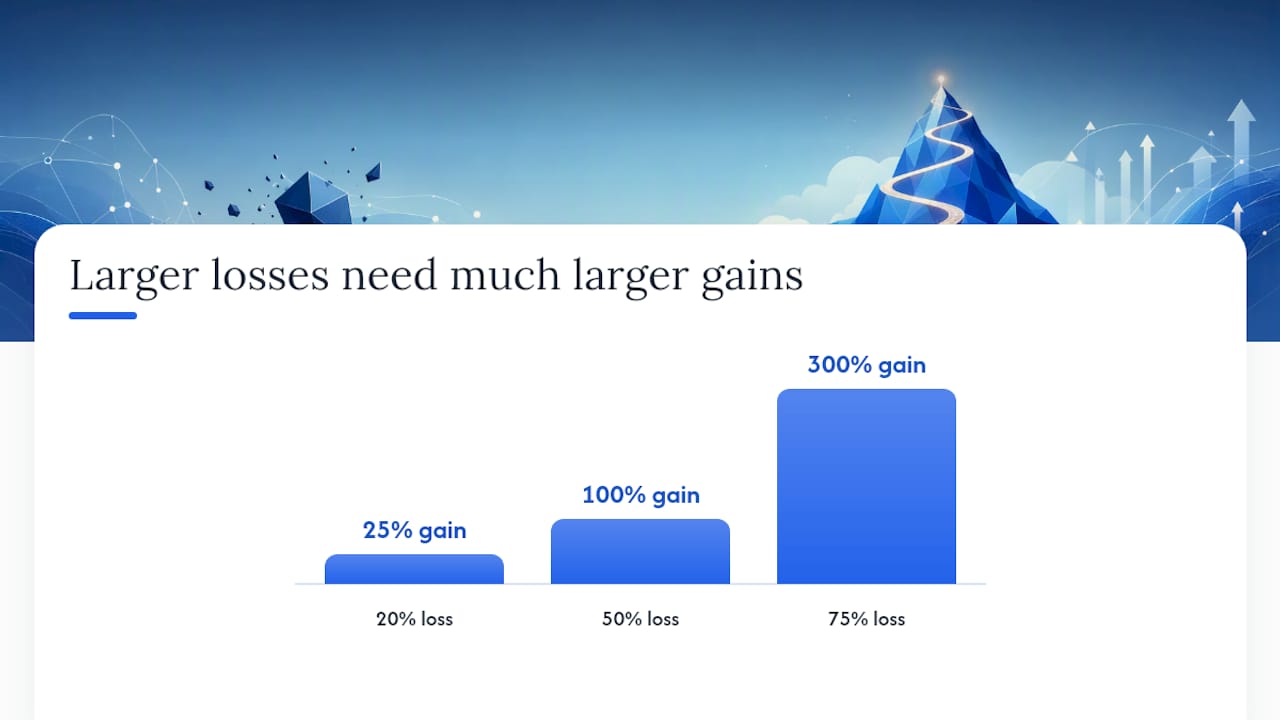
The math behind recovery is asymmetric, and it's the reason professional risk managers obsess over drawdown control rather than average returns:
- A 20% loss requires a 25% gain to break even.
- A 50% loss requires a 100% gain to return to the original peak.
- A 75% loss requires a 300% gain, a mathematical hole most strategies never climb out of.
This asymmetry, detailed in Ryan O'Connell's drawdown analysis, is why longer investment horizons can tolerate deeper MDDs while short-horizon capital, money you need in the next year or two, needs a much tighter ceiling.
Interpreting MDD for Portfolio and Investor Risk Profiles
There's no universal "good" MDD number. Benchmarking only makes sense within an asset class, a strategy type, and a comparable time window.
What MDD does well is test risk capacity, the financial ability to absorb a loss, as opposed to risk tolerance, the psychological willingness to sit through one. CFA Institute research frames MDD as a core input for balancing return objectives against the risk of negative outcomes, and separating capacity from tolerance is where a lot of financial planning conversations actually go wrong.
A few ways to sharpen the read:
- Pair MDD with the Calmar ratio (annualized return divided by MDD) to see return generated per unit of worst-case pain.
- Check volatility (standard deviation) alongside MDD. Two strategies with identical MDD can have very different day-to-day turbulence.
- Match liquidity need to drawdown tolerance. U.S. Bank's risk-profiling guidance treats a liquidity need above 5% of the portfolio as a signal that large drawdowns are far more dangerous than they look on a chart.
The limitation worth remembering: MDD is backward-looking. It says nothing about how often drawdowns occurred, only how deep the worst one got, and it's highly sensitive to whichever start and end dates you chose to measure. Change the window, and the number can shift dramatically.
Using Maximum Drawdown When Backtesting a Strategy
MDD only earns its keep in a backtest when it's read alongside win rate, profit factor, and expectancy, never in isolation.
The problem is that most backtests understate drawdown without the trader ever noticing. Common culprits:
- Look-ahead bias, where the backtest accidentally uses information that wasn't available at the time of the trade.
- Survivorship bias, testing only on assets or setups that survived to the present.
- Unrealistic cost assumptions, ignoring slippage and spread, which quietly hides how bad real drawdowns would have been.
Backtestify's own research on why most backtests lie walks through exactly how these distortions creep in. The fix is running out-of-sample MDD checks, testing rolling windows instead of one static period, and stress-testing sensitivity to position size and slippage before trusting a strategy's drawdown number with real capital.
Balancing Drawdown Risk With Return Objectives
Not every drawdown deserves a reaction. If a strategy's MDD stays within the range its backtest history predicted, that's the strategy working as designed, not a signal to abandon it. Act when the drawdown breaks past historical precedent, or when your own liquidity needs have changed since you sized the position.
A workable rule of thumb: cap your MDD tolerance well below what you'd need to liquidate assets you can't quickly replace. Pair that number with honest behavioral profiling, because the math of risk capacity versus risk tolerance only protects you if you're honest about which one is actually driving your decisions.
— WAJDI
Test Your Own Drawdown Numbers Before You Trade Them
Backtestify's edge is showing you a strategy's real historical MDD, not the polished version a content creator's highlight reel implies. Every published strategy report on the platform runs against actual historical market data, including the losing periods most people leave out.

You can reproduce the worked example from this article yourself, or stress-test a strategy you found on YouTube against real drawdown numbers before risking a dollar of capital. The Pro plan runs $29 a month or $190 a year and unlocks unlimited backtesting, optimization, and forecasting; the Free tier lets you start without a card. If you want the mechanics first, the step-by-step backtesting guide walks through building your first test from scratch. Either way, run the numbers before the market runs them for you.
This article is general information, not a substitute for advice from a qualified financial advisor. Consult a qualified financial professional about your own circumstances before acting on anything here.
Sources
- Maximum Drawdown (MDD) | Formula + Calculator
- Maximum drawdown as predictor of mutual fund performance flows — CFA Institute RPC
- Understanding Maximum Drawdown (MDD): Key Insights and Formula — Investopedia
- Maximum drawdown — Ryan O'Connell Finance
FAQ
What Is the Meaning of Maximum Drawdown?
Maximum drawdown is the largest percentage decline a portfolio or strategy has experienced from a peak value to its lowest point before recovering to a new high. It captures the single worst historical loss, not the average pain, which is why Investopedia treats it as a core downside risk benchmark.
What Is a Good Max Drawdown?
There's no fixed "good" number. It depends entirely on asset class, strategy type, and the investor's liquidity needs and time horizon, since a level that's fine for a decade long equity allocation could be unacceptable for near-term retirement funds.
How Do You Calculate Max Drawdown?
Identify the portfolio's peak value, then find the lowest value reached before a new peak forms. The formula is (Trough − Peak) / Peak, expressed as a percentage, as outlined in Wall Street Prep's calculation guide.
What Is the Maximum Drawdown of the S&P 500?
Maximum drawdown varies by measurement period and data source, and figures cited across different sites often disagree because they use different start and end dates. Rather than quoting a single figure, calculate MDD over the exact window relevant to your own investment horizon using the peak-to-trough method described above.
Can Backtestify Calculate Maximum Drawdown for My Strategy?
Yes. Backtestify's platform runs strategies against real historical market data and reports maximum drawdown alongside win rate, profit factor, and other metrics in every published strategy report, so you can see the worst-case loss before committing capital.