

Backtest Your Options Strategy With Realistic Fills and Robust Tests
Backtest options strategies using realistic fills, out of sample checks, and Monte Carlo stress tests. Try a free Backtestify account to run your first...

Yes, backtest every options strategy before risking capital. Start by writing a falsifiable hypothesis with mechanical entry and exit rules, not a vague idea like "sell premium when volatility is high." Then apply realistic fills, commissions, and slippage before you trust a single result the test spits out.
TL;DR:
- Backtests should include realistic fill assumptions, such as bid/ask spreads and slippage, because midpoint fills can significantly overstate profitability.
- Use at least five to seven years of historical options data covering various market conditions to account for volatility spikes and sideways markets.
- Proper backtesting requires exact, machine-readable rules for entry, exit, and roll adjustments to avoid logic errors and inconsistencies.
- Key metrics to evaluate include profit factor, return on risk, maximum drawdown, and trade distribution, as win rate alone is insufficient.
- Validate results with out-of-sample testing and parameter perturbation to ensure strategies are not overfitted and hold up across different regimes.
Table of Contents
- How to Backtest an Options Strategy the Right Way
- Data and Setup: Required Inputs and Realistic Fill Assumptions
- Building the Backtest: From Hypothesis to Recorded Results
- Key Metrics: What to Measure and How to Read the Numbers
- Common Backtest Mistakes and How to Stress-Test Your Results
- Choosing the Right Data and Tools for Your Budget
- What an Evidence-First Backtesting Platform Actually Checks
- When to Trust a Backtest, and When to Hold Back
- Start Validating Your Options Ideas With Backtestify
- Sources
- FAQ
How to Backtest an Options Strategy the Right Way
Backtesting an options strategy means replaying a set of mechanical rules against historical options data to see how they would have performed, trade by trade, across real market conditions. The goal isn't to predict the future. It's to characterize how a strategy behaves under stress, in calm markets, and everywhere in between, so you're not finding out the hard way with live money.
Options backtesting is genuinely harder than testing a stock strategy. A stock has one price at a time. An option chain has dozens of contracts across multiple strikes and expirations, each with its own bid, ask, and implied volatility, all moving independently as the underlying shifts. Your backtest has to reconstruct that whole surface accurately for every day in your test window, or the trades it simulates never could have happened in reality.
A few structural quirks make options testing its own discipline:
- Time decay and expiration mechanics mean a position's value erodes even when the underlying does nothing, which stock backtests never have to model.
- Assignment and early exercise risk on American-style options can end a trade before your rules say it should.
- The implied volatility surface shifts shape independently of price, so a strategy can lose money even when your directional read was correct.
Treat backtest output as a characterization of behavior across the past, not a forecast. A strategy that survived 2008, 2020, and 2022 tells you something real about resilience. It still doesn't guarantee the next drawdown looks the same.
Data and Setup: Required Inputs and Realistic Fill Assumptions
A backtest is only as honest as the data feeding it. Skimp here and every metric downstream is fiction.
At minimum, you need historical options chains with strikes, expirations, and bid/ask quotes, implied volatility by strike (the volatility smile or skew), the underlying's daily OHLC, dividend and split adjustments, and an accurate expiration and holiday calendar. Interactive Brokers' guide to backtesting options strategies points out that chain-level data with Greeks and IV is non-negotiable if you want a simulation that reflects what you could actually have traded.
Fill assumptions matter just as much as the data itself. Filling every trade at the midpoint flatters your results because real fills rarely land there, especially on wider, less liquid strikes.
| Assumption | Aggressive (unrealistic) | Realistic default |
|---|---|---|
| Fill price | Midpoint | Midpoint fills or conservative bid/ask fills |
| Commission | $0 per contract | commissions and slippage modeled realistically |
| Slippage | None | 1 to 3 cents per leg on liquid names, more on thin chains |
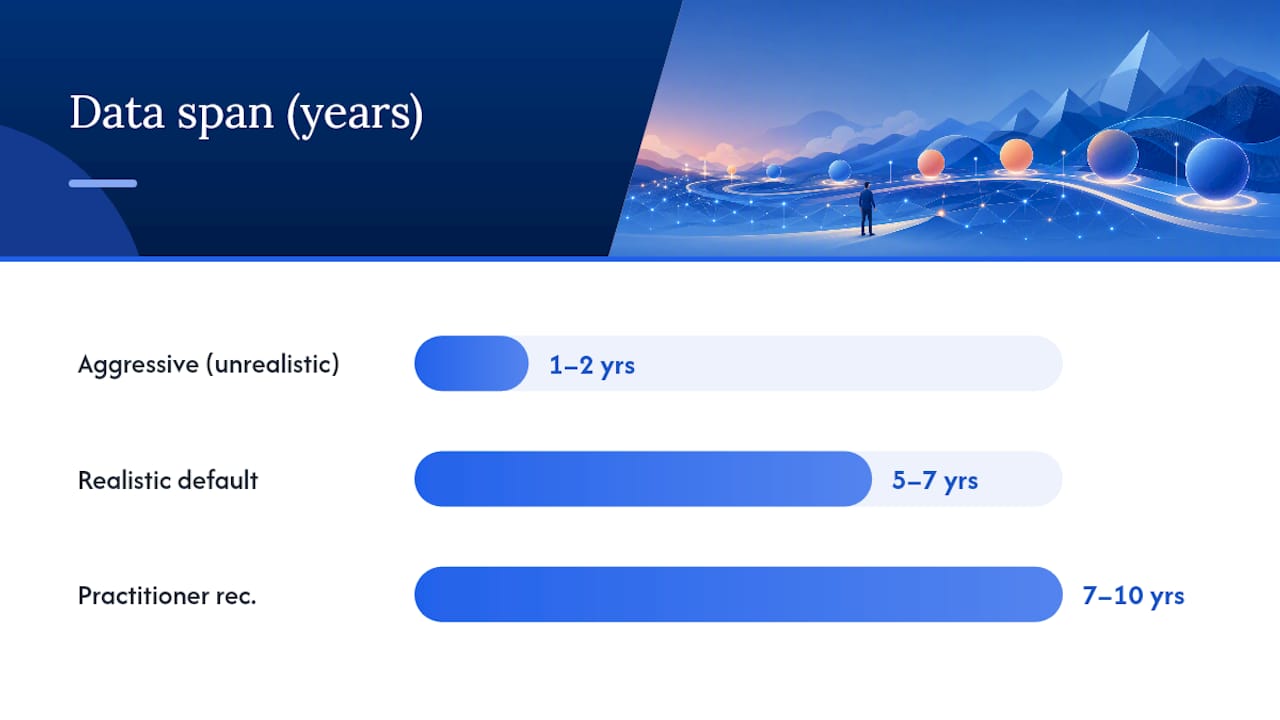
| Minimum data span | 1 to 2 years | 5 to 7 years, ideally covering multiple regimes |
Practitioner guides consistently recommend at least five to seven years of historical data, and often seven to ten when the data is available, because a shorter window can easily miss a volatility spike or a prolonged sideways grind that would have broken your rules.
Pro Tip: Run your backtest once with midpoint fills and once with conservative bid/ask fills. If the strategy's edge disappears under the second scenario, it was never a real edge, just a data artifact.
Building the Backtest: From Hypothesis to Recorded Results
A repeatable backtest follows a sequence, and skipping steps is how traders end up trusting numbers that don't hold up.
- Write a falsifiable hypothesis. "Selling 30 delta puts on high IV rank stocks generates positive expected value over a full cycle" is testable. "Sell puts when it feels like a good time" is not.
- Translate the hypothesis into machine-readable rules. Specify exact entry triggers (days to expiration, delta or strike selection, IV rank threshold), exit rules (profit target, stop loss, days-to-expiration cutoff), and what happens on assignment.
- Define position sizing and universe filters. Decide how much capital per trade, whether you filter for earnings dates, minimum liquidity, or sector exposure, and what your roll rules look like if the position needs adjusting before expiration.
- Run the simulation across your full historical window, not a cherry-picked slice that happens to flatter the strategy.
- Store the full trade log, not just a summary. Every entry price, exit price, days held, and P&L needs to be recoverable so you can audit anything that looks off.
- Segment results by year, quarter, and volatility regime. A strategy that only works in low-VIX grinds needs to say so explicitly.
The sizing and roll rules deserve extra attention because they're where most homemade backtests get sloppy. If your rules say "roll the short strike when tested," define exactly what "tested" means in price or delta terms, and apply that definition identically to every trade in the dataset. Inconsistent rule application, even unintentional, quietly turns a backtest into a story you wanted to be true.
Pro Tip: Export your trade log to a spreadsheet or Pine Script format and manually audit ten random trades against the raw options chain data. If you can't reconstruct exactly why the backtest entered and exited each one, the engine has a logic gap somewhere.
Key Metrics: What to Measure and How to Read the Numbers
Win rate alone tells you almost nothing about whether a strategy is worth trading. A strategy that wins 85% of the time can still be a slow-motion account killer if the 15% of losses are catastrophic.
Track these together, not in isolation:
- Profit factor (gross profit divided by gross loss), where anything meaningfully above 1.5 across a multi-year sample starts to look interesting.
- Return on risk relative to capital actually at stake per trade, not just raw dollar P&L.
- Maximum drawdown, both depth and duration, since a 20% drawdown that takes three months to recover from behaves very differently from one that takes two years.
- Trade frequency and distribution of returns, since a handful of outlier winners can mask a strategy that loses on most individual trades.
Backtesting guidance consistently emphasizes that distributions and drawdown duration matter more than the headline win rate, because two strategies with identical average returns can carry wildly different risk of ruin.
A high win rate paired with a huge max drawdown is the single most common red flag in options backtests, particularly with premium-selling strategies like naked puts or short strangles.
Common Backtest Mistakes and How to Stress-Test Your Results
Most bad backtests fail for the same handful of reasons, and every one of them is checkable before you go live.
- Look-ahead bias, where the simulation accidentally uses information that wouldn't have been available at the time of the trade, like end-of-day IV to make an intraday decision.
- Survivorship bias, where your universe only includes symbols that still exist today, quietly excluding the delisted or bankrupt names that would have hurt you.
- Overfitting through parameter snooping, where you tune delta, DTE, and profit targets until the backtest looks great, at which point it's memorized the past rather than found a real edge.
- Ignoring slippage and assignment risk, which inflates reported returns far beyond what a live account would ever see.
Robustness testing is how you catch these before they cost real money. Out-of-sample validation, where you build rules on one period and test them, unchanged, on a period you never looked at, is the single most important check. Parameter perturbation, nudging your delta or DTE settings by small amounts to see if performance collapses, tells you whether you found an edge or a coincidence. Monte Carlo resampling of trade sequences estimates how much your reported drawdown might vary from something crueler.
| Test result | What it tells you | Suggested action |
|---|---|---|
| Out-of-sample performance closely matches in-sample | Rules likely capture a real effect | Move to paper trading |
| Small parameter changes cause large performance swings | Likely overfit | Revise or simplify rules |
| Performance collapses in one regime only | Strategy is regime-dependent | To Add regime filters or reject |
Choosing the Right Data and Tools for Your Budget
The data source you pick shapes what kind of backtest you can even attempt. Broker on-demand data is convenient and often free with an account, but historical depth and chain completeness vary a lot by broker. Dedicated options data vendors offer cleaner, longer histories with full IV surfaces, at a real subscription cost. Building your own pipeline from raw exchange data gives full control but demands serious engineering time most individual traders don't have to spare.
Resolution matters less than people assume for most strategies. End-of-day data is enough for anything held more than a day or two, like monthly iron condors or 45 DTE credit spreads. Intraday, minute-level data only earns its cost for 0DTE strategies or anything with same-day entry timing that depends on intraday volatility spikes.
If you're working with a limited budget, a few things to keep in mind:
- Free data sources often have survivorship bias baked in, since delisted symbols get dropped from the historical record.
- Free feeds may lack full IV chains, which forces you to approximate volatility rather than measure it directly.
- Test any free dataset against a small known sample from a paid source before trusting it for a full backtest run.
What an Evidence-First Backtesting Platform Actually Checks
Backtestify's platform builds around a simple idea: a strategy claim isn't worth trusting until it's tested against real historical data and stress-checked for holes. That covers backtesting, rule-based strategy improvement, forward-looking forecasting with probability statistics, and transparent reporting of win rate, profit factor, and maximum drawdown on every strategy run.
Side-by-side comparisons between an original strategy and its improved version, tested on the same recent data, make overfitting easier to spot. If the "improved" version only wins on the exact window it was tuned against, that's a signal to keep digging rather than deploy capital.
Whatever platform you use, verify four things before trusting its output: where the historical data comes from, what fill assumptions it applies by default, whether commissions and slippage are modeled realistically, and whether you can reproduce the same trade log twice from identical inputs. If a platform can't answer those four questions clearly, treat its backtest results with real skepticism.
When to Trust a Backtest, and When to Hold Back
A backtest earns your trust when it survives out-of-sample testing, holds up under small parameter changes, and doesn't lean on one lucky year to carry the whole track record. Abandon a strategy that only works with suspiciously specific settings. Iterate on one that shows a consistent, if modest, edge across multiple regimes.
Sizing during rollout matters more than most traders admit. Start at a fraction of your intended position size, even after a clean backtest, because live psychology under real losses behaves nothing like a spreadsheet. Paper trade first, size up gradually, and let real-time results confirm what the backtest suggested before committing full capital.
— WAJDI
Start Validating Your Options Ideas With Backtestify
Backtestify gives you a direct way to test an options idea against real historical data instead of trusting a claim from a chart or a video. You get backtesting, rule-based improvement, and forecasting with probability statistics in one place, with win rate, profit factor, and max drawdown reported for every run, including the losing ones.
A good first task: pick one hypothesis, write mechanical entry and exit rules the way this article walks through, and run it against a full historical window using a free account before you commit real capital. Backtestify's published strategy library shows real examples of original versus improved strategies compared side by side, and the methodology page lays out exactly how each simulation handles data and assumptions, so you can check the work rather than take it on faith. When you're ready for unlimited testing and forecasting, Pro runs $29 per month or $190 per year; the free tier at Backtestify is enough to run your first real test today.
Sources
Before relying on any simulated results, check the SEC's investor alert on virtual trading, which warns that simulated performance can omit real execution costs. FINRA offers background on broker protections and market participant rules relevant to historical data sourcing. Review standardized options risk documentation for exercise and assignment mechanics your backtest must account for.
- How to Backtest an Options Strategy Before You Trade — Interactive Brokers
- How to Backtest Options Strategies (Step-by-Step) | Days to Expiry
FAQ
Can ChatGPT backtest a trading strategy?
ChatGPT can help you write backtest logic, structure your rules, or generate code, but it can't independently source or verify historical options chain data on its own. You still need a real dataset and execution engine, whether that's a dedicated platform like Backtestify, a coded pipeline, or a broker's historical tools, to get results you can actually trust.
What is the most successful option strategy?
There's no single strategy that wins across every market regime; performance depends heavily on the underlying, volatility environment, and how disciplined the entry and exit rules are. Strategies like covered calls, credit spreads, and iron condors show consistent behavior in backtests when tested with realistic fills, but "most successful" only means anything within a specific, tested timeframe and risk tolerance.
What is the best backtesting software for options trading?
The best choice depends on whether you need chain-level historical data, transparent metric reporting, and reproducible trade logs, which are the features to check regardless of vendor. Platforms like Backtestify focus specifically on evidence-based verification, including transparent win rate, profit factor, and drawdown reporting alongside strategy comparisons.
What is the best backtested trading strategy?
No strategy holds a permanent title, since market regimes shift and past performance never guarantees future results, as the SEC notes about simulated trading. The more useful question is which strategy holds up across out-of-sample testing, parameter perturbation, and multiple market regimes, since that's what separates a real edge from a curve-fit result.
How many years of data should an options backtest cover?
Most practitioner guides recommend a minimum of five to seven years, with seven to ten years preferred when the data is available, to capture multiple volatility regimes and at least one significant drawdown event. A shorter window risks missing the exact conditions that would eventually break the strategy.